Industry
-
Fuel consumption by sub-sector sourced from IEA energy balance. The breakdown of the industrial sectors can be seen below, together with the correspondence with the sectoral breakdown used in the IEA energy balances
KiNESYS Units Description IEA FLOW IPC mt Petrochemicals - multiple products with different technologies with feedstock and fuel input CHEMICAL,NECHEM IFP Petajoules Food processing FOODPRO IIS mt Iron and Steel IRONSTL ILP mt Pulp and Paper PAPERPRO IMC Petajoules Mining and Construction CONSTRUC,MINING INF mt Non-ferrous metals NONFERR INM mt Non-metals NONMET IOI Petajoules Other INONSPEC,TEXTILES,WOODPRO ITM Petajoules Transport equip and machinery MACHINE,TRANSEQ ONO Petajoules Other non-specified ONONSPEC Industry sub-sectors represented in KiNESYS
-
End-use fuel consumption splits into energy services sourced from 2018 MECS
KiNESYS Description MECS service STM Steam Conventional Boiler Use PRH Process heat Process Heating PRC Process Cool Process Cooling and Refrigeration MDR Machine drive Machine Drive ECP Electrochemical Electro-Chemical Processes OTP Other process Other Process Use SPC Space conditioning Facility HVAC LIG Lighting Facility Lighting OTH Other facility Other Facility Support, Onsite Transportation, Conventional Electricity Generation, Other Non-process Use Energy services in KiNESYS
-
Physical production of industries sourced from USGS and FAOStats
-
New technologies (producing energy services) sourced from EPA-US9r model
Petrochemicals
The petrochemical industry supplies the materials the rest of the economy is built from, and it is the one industrial sector where most of the carbon is not burnt but embodied — it leaves the refinery as feedstock and ends up in the product. That makes it structurally different from steel or cement, and it is why the sector is represented here as an explicit chemistry: a network of processes converting named molecules into named molecules, rather than an energy intensity applied to a tonnage.
Scope and Coverage
How the sector is assembled
The chemistry lives in a hand-maintained workbook, VT_KiNESYS_petchem.xlsx: 66 processes and 62 commodities across 23 sheets, each sheet a product family with its own coefficient tables and costs. A small pipeline of six scripts sits beside it and regionalises two things — existing steam cracker capacity, and product demand. Everything else about the technology is entered by hand and reviewed by hand.
This is worth stating because it sets what can be changed quickly and what cannot. Adding a region or refreshing demand is a pipeline run. Adding a process, a product or a route is an edit to the workbook.
Products
62 commodities, of which 23 carry an explicit demand projection. The chain runs from feedstocks through olefins and aromatics to polymers and finished intermediates:
| Family | Commodities |
|---|---|
| Olefins | ethylene, propylene, butadiene, isobutene |
| Aromatics | benzene, toluene, xylene, ethylbenzene, styrene, pygas |
| Polymers | LDPE, HDPE, LLDPE, polypropylene, PVC, polystyrene |
| Vinyls chain | EDC, VCM, chlorine, caustic soda, HCl |
| Nitrogen chain | ammonia, urea |
| Oxygenates | methanol, ethylene oxide, ethylene glycol, propylene oxide, propylene glycol, acetic acid, vinyl acetate, 2-EH, MTBE |
| Industrial gases | hydrogen, oxygen, nitrogen, argon, carbon monoxide |
Processes
Steam cracking is modelled on three feedstocks — naphtha, ethane and propane — each with a conventional furnace, an electrically heated variant, and a variant with carbon capture, so nine cracker processes in all. Around that sit propane dehydrogenation, catalytic reforming of naphtha with and without capture, hydrodealkylation and toluene disproportionation for aromatics, the full chlor-alkali and vinyls chain through three cell technologies, and the polymerisation routes: Ziegler-Natta, bulk and emulsion, and dedicated LDPE, HDPE, LLDPE and PVC processes.
Ammonia is Haber-Bosch, fed by hydrogen from either steam methane reforming or electrolysis. Methanol has four routes — coal, gas, gas with capture, and green hydrogen with captured CO₂. Steam for the whole sector comes from eight boilers covering electricity, gas, coal, hydrogen and biomass, five of them with capture variants.
Feedstocks
Feedstock enters through nine explicit bridge processes that connect the host energy system to the sector's internal commodities: ethane, methane, propane, naphtha, coal, hydrogen, captured CO₂, coal tar, and a gasoline return stream. Keeping the bridge explicit is what lets the sector's feedstock carbon be accounted separately from its process energy.
Decarbonization levers represented
Electrification of steam cracking. Electric crackers exist for all three feedstocks and are real technology choices, not a scaling assumption. They replace furnace fuel with roughly 10–13 units of electricity per unit of feedstock throughput, which is the trade the model is being asked to evaluate: cracking becomes a large new electricity load in exchange for eliminating the furnace flue gas.
Carbon capture is available on the three crackers, on gas-based methanol, on catalytic reforming of naphtha, and on the gas, coal and biomass boilers.
Carbon utilisation is implemented rather than described. Urea production consumes CO₂ as a physical input, and green methanol consumes captured CO₂ together with hydrogen, drawing on a dedicated ind-ccu_co2 commodity that carries CO₂ eligible for conversion into fuels and products.
Hydrogen is consumed by ammonia synthesis, by green methanol, and by HCl production, and is produced either by reforming or by electrolysis, so the grey-to-green transition is a choice inside the sector rather than an assumption about it.
Emissions and the capturable set
Process chemistry emissions are carried on a dedicated pc_co2 commodity rather than inferred from fuel — steam methane reforming, coal and gas methanol synthesis and the crackers all emit onto it explicitly. Combustion emissions from furnace fuel and boilers arrive through the host fuel commodities in the usual way. pc_co2 is inside the host's capturable industrial emissions group, so petrochemical process CO₂ can genuinely be captured.
Feedstock carbon is tracked separately from process energy. In the reference case the sector consumes about 37,700 PJ as feedstock against about 16,100 PJ as process energy, and the feedstock figure sits within a few percent of the IEA's non-energy use statistics — which is the strongest calibration evidence the sector has, since feedstock is stoichiometric and admits no efficiency argument.
Regional coverage, and its main limitation
Demand is projected for 23 products across the model's regions and the base-year world total is about 979 Mt. Existing capacity is a different matter, and this is the most important caveat in the sector.
Only steam crackers carry existing capacity. Operating crackers are placed from an ethylene asset database across 35 regions, with committed and under-construction units added separately for 9 more. Ammonia, methanol, chlor-alkali, the polymers and every downstream intermediate have no existing stock at all, so from the model's point of view they can be built anywhere, in any quantity, from the first period. Build-rate constraints limit how fast that happens, but not where.
The practical consequence is that the sector answers questions about cracker siting and feedstock slate much better than it answers questions about where ammonia or methanol production is located today and what it would cost to move.
Note
Planned, not yet in the model. Existing capacity for the non-cracker chain — ammonia, methanol and chlor-alkali in particular, all of which have well-documented asset registers. Also planned: a natural gas liquids fractionation step, since ethane supply currently reaches the crackers without passing through the separation that produces it.
Demand
Product demand is specified as explicit levels from 2020 to 2030, followed by a single annual growth rate carrying each product to 2050. The 2020–2030 levels come from market data; the growth rate is fitted to that decade and then damped, because an unmodified extrapolation of a single decade's growth over twenty further years produces implausible tonnages. The damping is a judgement, and it is the largest single discretionary assumption in the sector.
Model Outputs
- Feedstock slate by region — which molecules the crackers are actually eating, and how that shifts as relative gas and oil prices move.
- Process energy and feedstock carbon reported separately, which is necessary in a sector where most of the carbon never becomes CO₂ inside the model boundary.
- Electrification uptake — how much cracking capacity converts to electric heating, and what that adds to industrial electricity demand.
- Capture and utilisation flows, including CO₂ routed into urea and into green methanol.
- Hydrogen demand split between reforming and electrolysis.
Planned extensions
| Extension | Why it matters |
|---|---|
| Existing capacity outside crackers | Ammonia, methanol and chlor-alkali are unconstrained greenfield in every region, so the model cannot see stranding or relocation for most of the sector |
| Bio-based feedstocks | Bio-naphtha, bioethanol-to-ethylene and methanol-to-olefins are the main defossilisation route for embodied carbon and none of them is represented; biomass currently appears only as a boiler fuel |
| Fibres and the polyester chain | PTA, PET and the synthetic fibre chain are absent, which leaves a large share of textile-bound petrochemical demand outside the model |
| Synthetic rubbers | Butadiene is produced but has no downstream polymerisation |
| Polyethylene grade resolution | LDPE, HDPE and LLDPE exist as separate products but share a single demand series, so grade substitution cannot be examined |
| Natural gas liquids fractionation | Ethane reaches crackers without the separation step that produces it, which distorts the feedstock economics |
| Process energy calibration | Modelled process energy sits about a third below the IEA's reported figure, a gap that is documented but not closed |
| Syngas as a traded intermediate | Co-production is described in the sector's own literature but syngas is not a commodity here |
Iron and Steel
Steel is the largest industrial source of CO₂ and the sector where the choice between decarbonization pathways has the widest consequences — not only for emissions, but for which mines stay open, which ports stay busy, and where ironmaking physically happens. KiNESYS models it as a full material chain from ore to finished steel, built on a plant-level asset database, and set inside an energy system that simultaneously decides the electricity, hydrogen and biomass those pathways compete for.
Scope and Coverage
How the sector is assembled
The existing fleet comes from the Global Energy Monitor iron and steel tracker: every plant, its route, its capacity and its vintage. That becomes a set of country-tagged processes carrying vintaged existing capacity, so a 1990s blast furnace retires on its own schedule rather than a sector average. Alongside it sits a region-generic menu of greenfield technologies the model may build anywhere from its start year.
As with the other industrial sectors, the output is a pair of workbooks: one country-level and region-agnostic, one carrying the model's region set through availability mapping, demand and discount rates.
Production routes in the existing fleet
Ten route types, each instantiated per steel-producing country and per vintage:
| Route | What it covers |
|---|---|
| Coke ovens | Coking coal to metallurgical coke, with coke oven gas recovered |
| Sinter and pellet plants | Agglomeration of ore fines and concentrate for blast furnace or DRI feed |
| Blast furnace | Hot metal from coke and agglomerate, with blast furnace gas recovered |
| Basic oxygen furnace | Hot metal and scrap to crude steel |
| Gas-based DRI | Midrex-type shaft furnace on natural gas |
| Coal-based DRI | Rotary kiln, the dominant route where gas is unavailable |
| Electric arc furnace | Scrap-based steelmaking |
| DRI-fed electric arc furnace | Sponge iron melted with scrap |
| Rolling and finishing | Crude to finished steel, returning home scrap at a 94% yield |
The greenfield technology set
Nineteen technologies the model may build, spanning incremental improvement to breakthrough:
- Conventional replacements — sinter, pellet, blast furnace, gas and coal DRI, BOF, EAF, DRI-fed EAF, coke ovens, rolling
- Efficiency variants — coke ovens with heat recovery, electrified rolling, near-net-shape casting
- Hydrogen routes — hydrogen direct reduction, gas-DRI with hydrogen blending, blast furnace with tuyère hydrogen injection
- Capture variants — blast furnace and BOF with capture
- Breakthrough — molten oxide electrolysis, direct electrolytic ironmaking
Hydrogen direct reduction consumes about 6.5 GJ of hydrogen and 0.75 GJ of electricity per tonne of sponge iron, on top of 1.42 tonnes of pellets. It and molten oxide electrolysis carry explicit cost learning curves rather than static capital costs, because both are pre-commercial and their economics in 2050 are a function of how much gets built before then.
Material commodities
Nine material commodities carry the chain: iron ore, sinter, pellets, pig iron, sponge iron, crude steel, scrap, slag, and finished steel as the demand commodity. Energy and process gases — electricity, gas, coke, coal, hydrogen, blast furnace gas and coke oven gas — are the host system's own carriers, which is what puts steel in competition with every other sector for them.
Slag is tracked because it leaves the sector: it is the highest-quality supplementary cementitious material there is, and the cement module consumes it.
Energy coefficients are calibrated, not assumed
Rather than apply literature energy intensities uniformly, the sector calibrates its coefficients against IEA energy balances. Reported blast furnace, coke oven and iron and steel energy for each country is divided by that country's actual production from the plant database, and the result is blended with literature priors according to how credible the observation is. Capacity utilisation is separately calibrated against worldsteel production statistics.
This matters because the alternative — nameplate capacity times a global intensity — misses by a wide margin in exactly the countries where the sector is growing fastest.
Scrap
Scrap availability is projected per country to 2050 from steel stock accumulation, and enters as an upper bound on a domestic scrap supply process. Home scrap returns from rolling within the model. The projection distinguishes obsolete, prompt and home streams in its source data, but the model consumes a single pooled scrap commodity.
Key Features for Decarbonization Analysis
Hydrogen-based direct reduction. The complete replacement of natural gas or coal with hydrogen, producing sponge iron with near-zero direct emissions and a very large hydrogen appetite. Because hydrogen is a system commodity here rather than a sector assumption, the model prices it against every other hydrogen use and against the renewable electricity needed to make it.
Molten oxide electrolysis. Direct electrolytic ironmaking, available late and expensive, included so that the long-horizon question — what happens if electrochemistry works — can be asked rather than assumed away.
Scrap-based steelmaking. The circularity ceiling is a physical result rather than an input. Scrap availability is set by how much steel was made in previous decades and how long it lasts, and the model consistently finds scrap-EAF capping around 40–45% of global crude steel demand even under maximum decarbonization pressure. The remainder must come from primary iron, which is what keeps iron ore in the picture in every scenario.
Process efficiency. Modern blast furnaces, heat-recovery coke ovens, electrified rolling and near-net-shape casting, each with its own capital cost, so efficiency competes against fuel switching on economics rather than being imposed.
Regional contextualisation. Capital costs are differentiated by region through industry-specific discount rates derived from sector betas, with first-of-a-kind premiums applied to pre-commercial technologies. Iron ore supply carries country-level mining costs. Resource endowment, not just technology cost, decides where routes locate.
Carbon capture
Capture is represented, but it is worth being precise about where.
Steel's combustion emissions arrive on the host system's industrial CO₂ commodities, and those sit inside the host's capturable industrial emissions group, with a dedicated commodity for CO₂ captured from fossil combustion in iron and steel. So capture is available to the sector and does real work in scenario comparisons — the results below were produced this way.
What that mechanism cannot do is distinguish one blast furnace from another. It acts on the sector's emissions in aggregate rather than on a specific process, so the model decides how much steel CO₂ to capture, not which plant captures it.
Note
Planned, not yet in the model. Process-level capture. Blast furnace and BOF capture variants are defined with 90% capture rates, but as currently emitted they carry the capital cost and energy penalty of capture without the captured CO₂ flow — which makes them strictly worse than their unabated equivalents and means they will never be built. Wiring the capture flow through is what would let retrofit economics, capture rates by route and the survival of specific incumbent assets be examined properly, rather than only the sector-level question of how much to capture.
International trade
Steel decarbonization is as much a story about restructuring global trade as about changing technology, and five commodities carry that story: iron ore, coking coal, steel scrap, sponge iron and crude steel.
Iron ore is the dominant seaborne dry bulk today. Coking coal is concentrated among a few exporters and disappears entirely under deep decarbonization. Scrap trade grows with EAF capacity. Sponge iron barely features in today's trade but becomes a major flow when direct reduction gravitates to regions with cheap gas or renewable hydrogen and ships the intermediate product to steelmakers elsewhere. Crude steel is traded as semi-finished product, subject to constraints reflecting reheating costs, quality control and industrial policy.
Restricting crude steel trade forces the model to use sponge iron as the primary mechanism for international material flow — a choice with large consequences for ports, shipping and regional industrial structure.
Note
Trade links for these commodities are configured in the host model rather than emitted by the steel sector build. A host assembled from the sector workbooks alone will have the full production chain but no trade, and its regions will each have to meet their own demand.
Model Outputs
- Energy and emissions by route and region, including technology-specific emission intensities and the indirect emissions that follow from electricity and hydrogen sourcing.
- Technology adoption — hydrogen DRI penetration, EAF expansion against the scrap ceiling, capture volumes, and the investment those imply.
- Cost and competitiveness — production cost by route, the green premium on crude steel, and the effect of carbon border adjustment.
- Material flows — ore demand by region, coking coal requirements, scrap circularity rates, and hydrogen demand for steel.
- Visualisation — Sankey diagrams of material flow for any scenario and region, trajectory charts across large scenario ensembles, and trade composition and net-position charts.
Illustrative Findings
The following illustrate the kind of insight the model produces when scenario dimensions — carbon price, capture availability, technology cost, trade regime — are varied systematically. They are representative, not prescriptive.
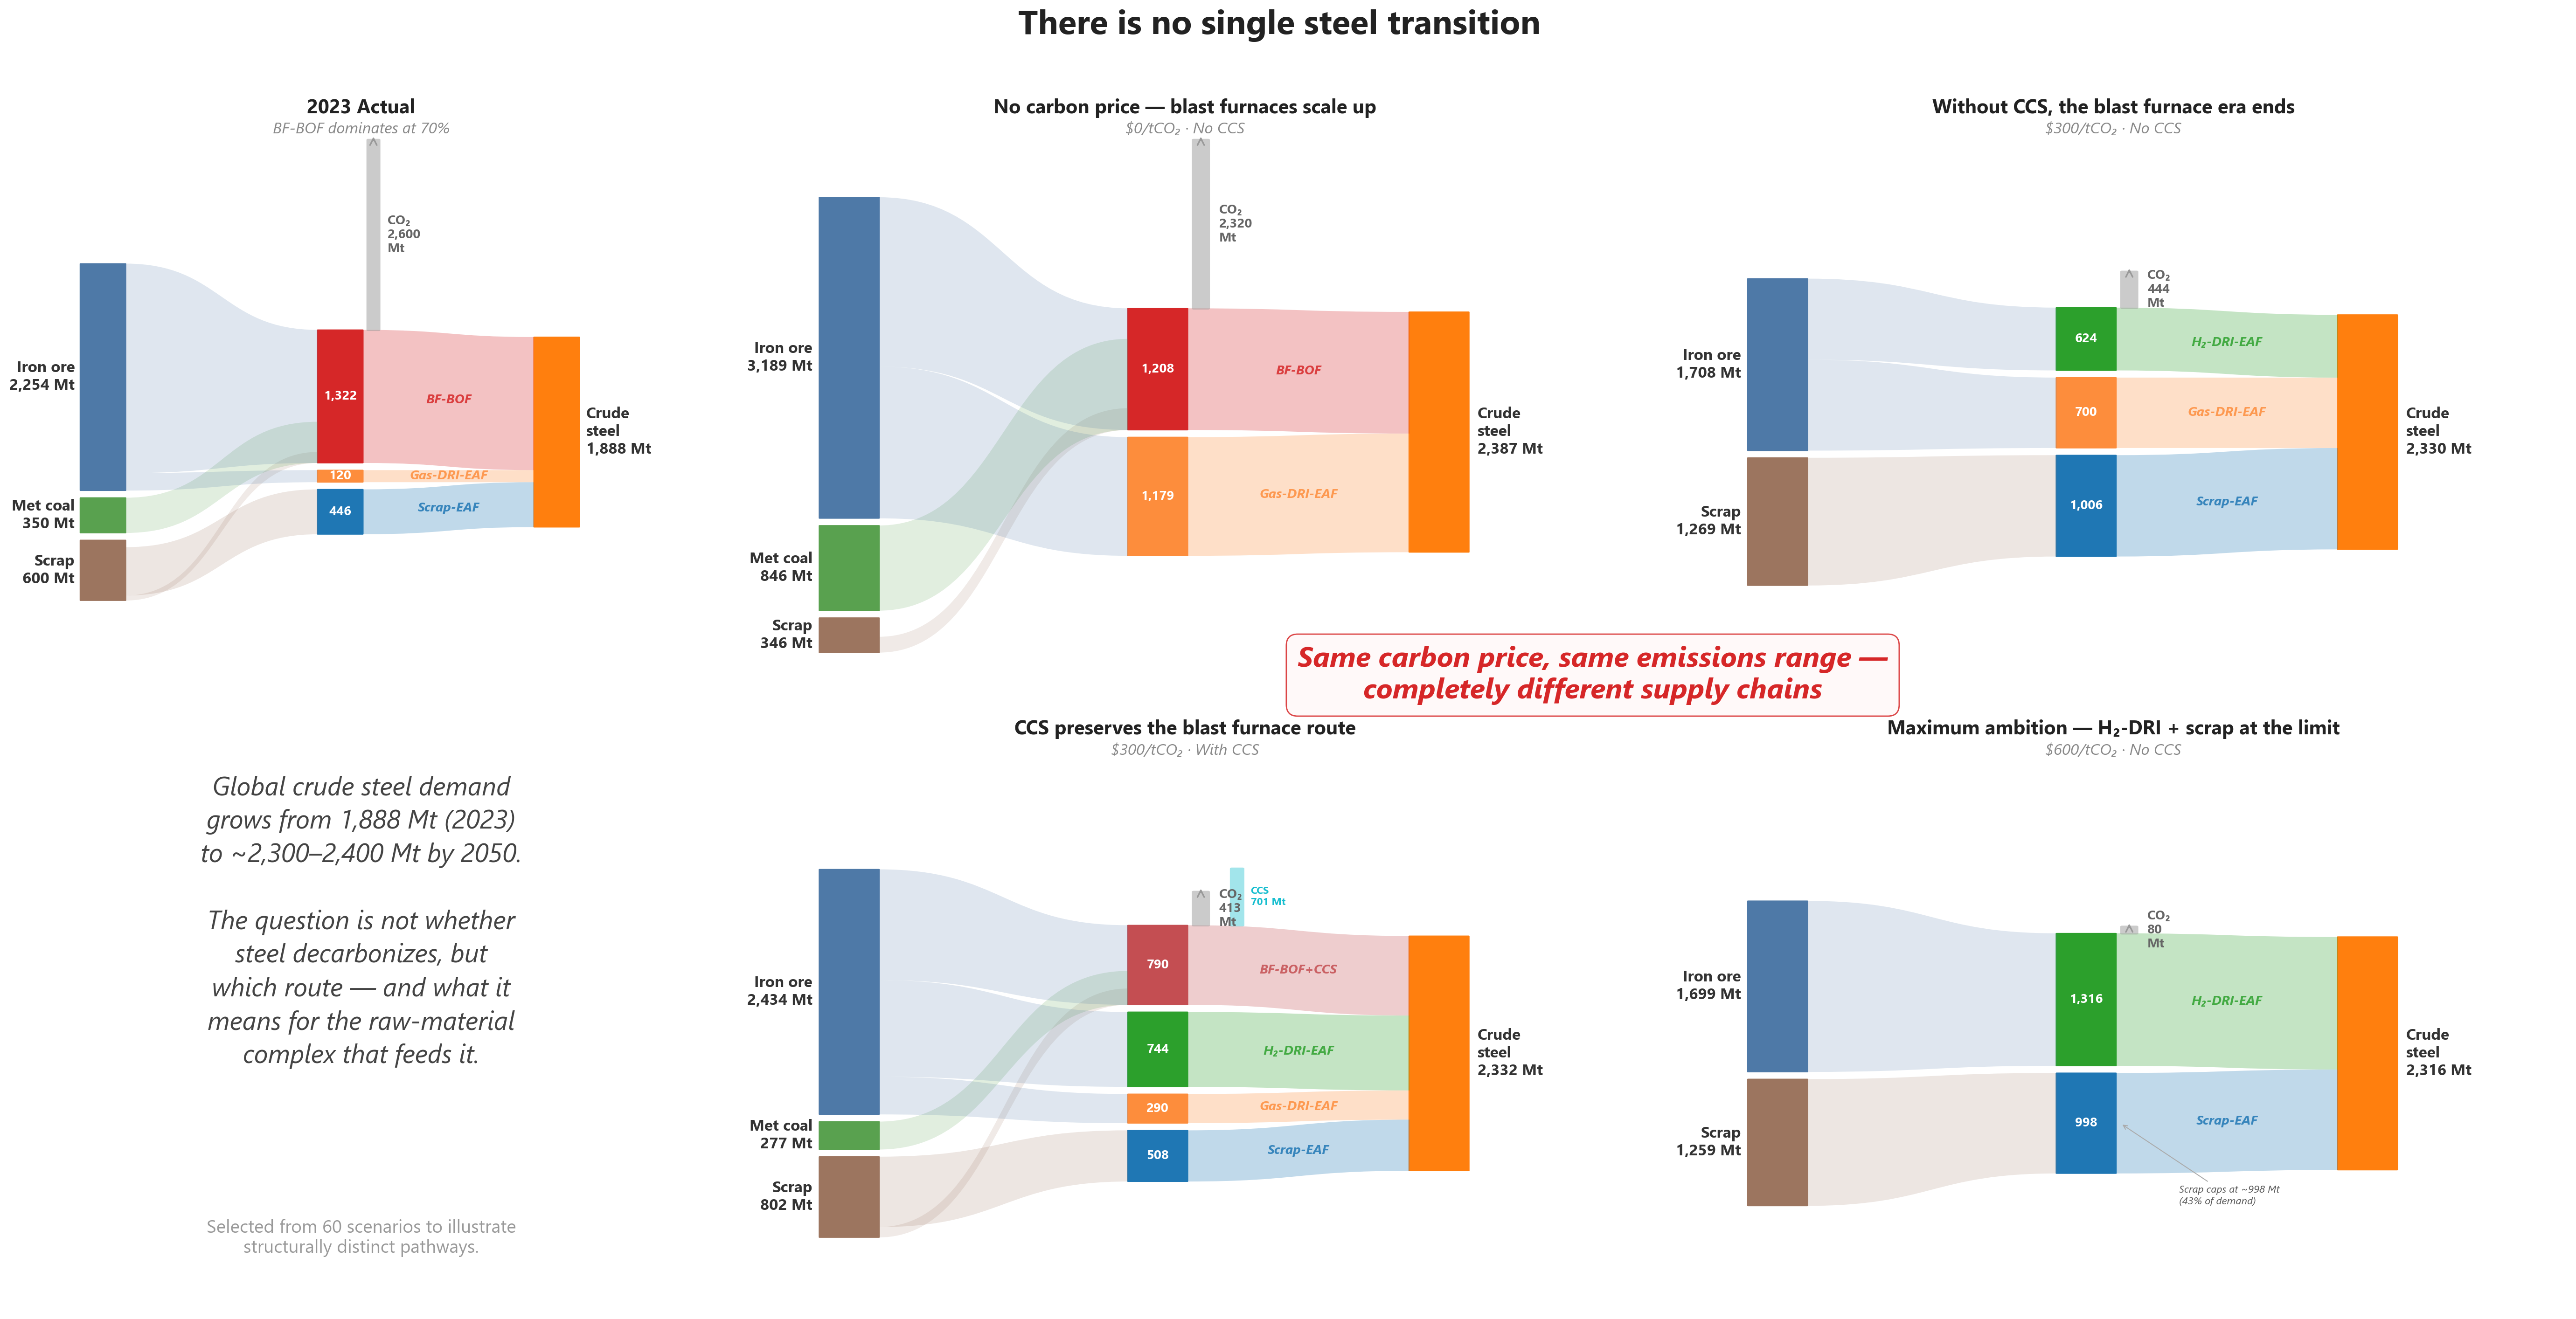
Structurally distinct futures at the same carbon price. Under a moderate carbon price with capture available, the blast furnace route can survive, preserving the iron ore and coking coal supply chain. Under the same carbon price without capture, blast furnaces are eliminated entirely: direct reduction and scrap-based EAF dominate, coal disappears, and the energy mix shifts to gas, hydrogen and electricity. Both achieve comparable emissions reductions of 75–85% below baseline, but the industrial structures — and therefore the infrastructure, trade and employment implications — are completely different.
This is the sector's central finding, and it is an argument for modelling capture availability as a scenario dimension in its own right rather than folding it into a carbon price.
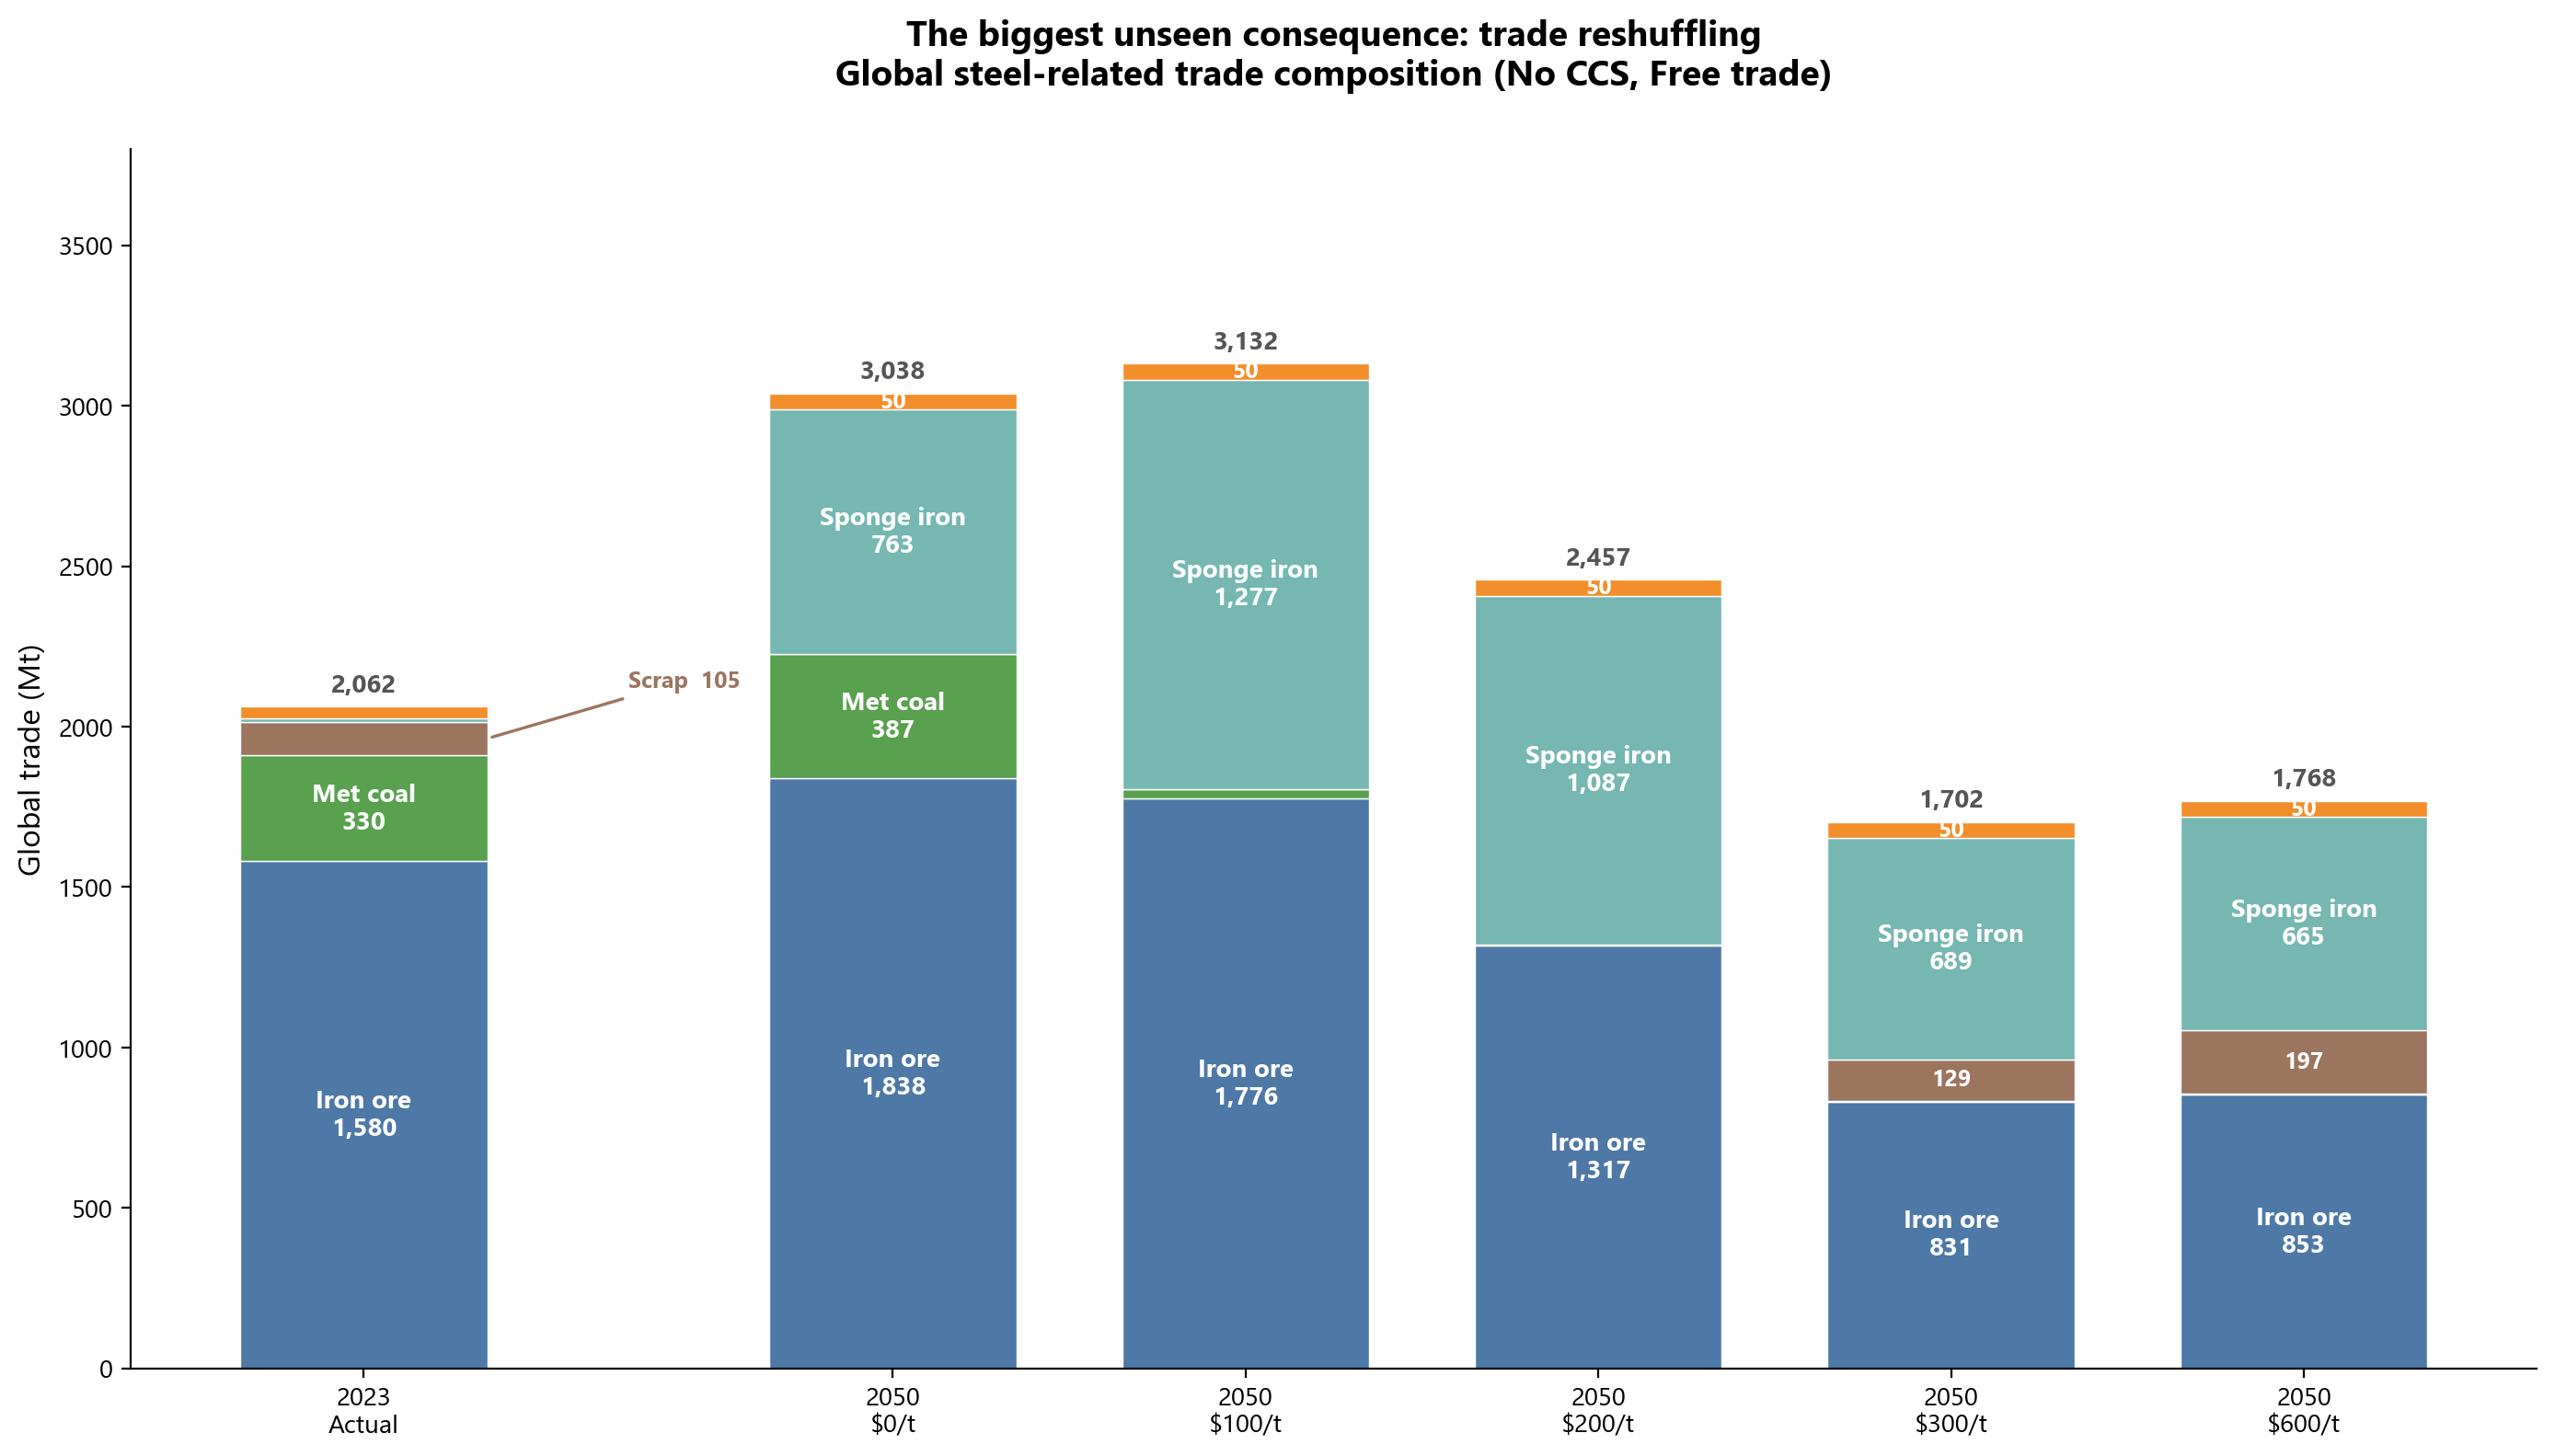
Trade reshuffling, not just trade reduction. Steel-related global trade can initially increase under low-to-moderate carbon prices, as direct reduction concentrates in gas- and renewables-rich regions and ships sponge iron globally. At higher carbon prices total volumes decline, but the composition is unrecognisable: coking coal disappears, iron ore demand halves, and sponge iron becomes the dominant traded intermediate.
Bounded green premium. Across a wide range of scenarios the model-implied cost of crude steel rises by roughly 20–35% under ambitious decarbonization relative to a no-policy baseline — significant for a commodity-grade product, but far below the two- to three-fold premiums sometimes cited.
No purely circular future. Even under maximum scrap utilisation, EAF production from scrap caps around 40–45% of global crude steel demand. The remaining 55–60% must come from primary iron, so ore continues to be mined and traded in every future. The question is whether it feeds blast furnaces or direct reduction plants.
Hydrogen consumption at scale. Deep decarbonization implies hydrogen consumption by steel alone on the order of 25–60 Mt per year by 2050 — a substantial fraction of projected global clean hydrogen supply, and a critical input to hydrogen infrastructure planning.
Cross-sector coupling
Steel does not decarbonize in isolation, and the couplings run in both directions.
It competes for electricity, hydrogen, biomass and capture capacity with every other sector, and those competitions decide which route is affordable. It also supplies: blast furnace slag is the best supplementary cementitious material available, and the cement sector depends on it to reduce clinker content. A steel pathway that eliminates blast furnaces therefore removes cement's cheapest abatement option at the same time. Neither sector modelled alone would see it.
Planned extensions
| Extension | Why it matters |
|---|---|
| Process-level capture flow | Capture variants are defined but emitted without the captured CO₂, so they are currently unbuildable and retrofit economics cannot be examined |
| Trade links emitted with the sector | The five traded commodities are configured host-side, so a host built from the sector workbooks alone has no steel trade at all |
| Scrap quality grades | Obsolete, prompt and home scrap are distinguished in the source data but pooled into one commodity, so scrap quality cannot constrain product mix |
| Fluxes and refining agents | Limestone and dolomite are consumed in reality and carry calcination emissions; neither is a commodity here |
| Secondary refining and casting as stages | Ladle refining and continuous casting are absorbed into rolling, so their energy and their electrification potential are not visible |
| Existing-fleet retrofit economics | Existing capacity enters through vintaged stock without investment costs, so the choice between retrofitting and replacing an asset is not priced |
Non-Metallic Minerals
Cement, brick, lime, glass and ceramics are ISIC 23, which the IEA reports as a single NONMET subtotal. KiNESYS models all five together as one module, INMM, because they share raw materials, share a statistical envelope, and compete for the same alternative fuels. Between them they are the largest source of industrial process CO₂ in the world economy — CO₂ that comes out of the limestone rather than out of the fuel, and which no amount of fuel switching can touch.
| Sub-sector | Output | Energy | Basis of the production estimate |
|---|---|---|---|
| Cement | 3,881 Mt | 11,304 PJ | Global Energy Monitor plant database, 3,884 plants, calibrated to USGS |
| Brick | 2,755 Mt | 5,209 PJ | Six country studies covering 68% of world energy; Olsson et al. 2025 |
| Lime | 430 Mt | 1,978 PJ | USGS; ten named producers account for 315 Mt |
| Ceramics | 326 Mt | 1,560 PJ | Acimac/MECS tile survey, twelve producers |
| Glass | 175 Mt | 1,391 PJ | China NBS flat glass, proxies elsewhere |
Non-metallic minerals as modelled
Two things about that table are worth stating plainly, because they shape everything downstream.
Cement is built differently from the other four. It rests on a plant-level asset database — every kiln in the world, with its capacity, vintage and technology — so the model carries the existing fleet as vintaged stock with country-specific retirement schedules. The other four have no such database anywhere. For them the model carries a tonnage, an energy intensity, and a menu of kiln technologies with a base-year mix over it. The two halves therefore answer different questions well: cement can be asked about stranded assets and retirement timing, brick and lime cannot.
The five do not fit inside the reported statistics. Modelled energy for the five comes to roughly 21,400 PJ against an IEA NONMET of 16,340 PJ. That is not an error to be tuned away — see Reconciliation with the IEA balances, where it turns out to be the single most informative result the module produces.
Scope and Coverage
How the sector is assembled
The module is emitted as a pair of workbooks. One is region-generic and carries the technology — processes, costs, lifetimes, output coefficients, fuel converters. The other carries everything that has a region dimension — calibrated energy inputs, base-year activity bounds, and demand. Changing the model's region set rebuilds only the second.
Processes for brick, lime, glass and ceramics carry no region in their names. This is deliberate and it is a correctness requirement, not a convenience: a process named after the region that happened to have it in the base year exists only in that region, so a kiln absent from a region's base-year mix could never be built there in any later period either. Africa had no zigzag brick kilns in 2023; under a region-named convention Africa could never build one — the cheapest abatement option in the entire sector, foreclosed as a side effect of a naming choice. Every kiln therefore exists everywhere from the start, the base-year fleet is expressed as bounds rather than as existence, and from the second period the model chooses freely.
Cement is the exception: its processes are country-tagged, because there the country detail is real observed asset data rather than an artifact.
Shared raw materials
Limestone, clay and gypsum are quarried by sector-neutral processes rather than by cement's own. Cement pulls about 80% of the world's quarried limestone, but lime kilns buy 1.8 tonnes of the same rock per tonne of quicklime, and glass takes it in the batch. Quarrying carries diesel for drilling, blasting and haulage and electricity for primary crushing — 203 PJ for cement alone, about 1.8% of its energy.
Fuel routing
Each sub-sector has its own kiln-heat commodity, produced from the host industrial fuel commodities by explicit converters:
| Heat commodity | Fuels permitted |
|---|---|
inm_cem_kilnheat |
coal, gas, oil, biomass (two cost tiers) |
inm_brk_kilnheat |
coal, biomass, gas, oil |
inm_lim_kilnheat |
coal, gas, oil, biomass |
inm_gls_furnheat |
gas, oil, coal |
inm_cer_kilnheat |
gas, coal, biomass, oil |
They are separate rather than shared because the fuels are not interchangeable. A brick clamp kiln burns rice husk and a glass furnace cannot — particulates and alkali ash ruin the melt. A single shared heat commodity would let the model fire float glass on crop residue. Note in particular that biomass is not available to glass, and that this is a physical constraint rather than an omission.
Which fuel is burnt is otherwise the model's choice. The base-year kiln mix is pinned; the base-year fuel mix is reported as an audit trail but is not imposed, except in cement where the alternative-fuel share is explicitly bounded.
Cement
Scope
Cement is represented as four stages, quarry to product, with a technology choice at three of them:
diesel + electricity                        -> quarry   -> limestone, clay, gypsum
limestone + clay + electricity              -> raw mill -> raw meal
raw meal + kiln heat                        -> kiln     -> clinker + process CO2
clinker + SCM + gypsum                      -> grinding -> cement
coal/gas/oil/biomass                        -> converters -> kiln heat
slag/fly ash/pozzolan/limestone filler      -> blender    -> SCM
That comes to 1,527 processes over 166 countries, built from the Global Energy Monitor plant database and calibrated against USGS production.
Kiln technologies. Dry precalciner (3.30 GJ/t clinker), dry preheater (3.60), and wet (5.50), plus a preheater-to-precalciner retrofit available where preheater capacity survives. Kiln type, capacity and vintage come from the plant database; where the database does not record precalciner status it is inferred within physical bounds rather than assumed.
Existing stock is vintaged. Kilns, mills and grinding plants carry vintage-specific lifetimes, so a 1970s line retires on its own schedule rather than on a sector average. Those schedules are floored so that nothing recorded as operating today retires before 2035 — cement plants get refurbished rather than replaced, and 1970s kiln shells are routinely still turning.
Raw grinding is a lever. Ball mills at 15 kWh/t of meal against vertical roller mills at 11, with the base year split 40/60. Separating the stage out of the kiln coefficient moves no energy; it makes about 37 PJ of headroom visible to the optimiser that was previously buried in an assumption.
Decarbonization levers represented
Alternative fuels, with an adoption ramp. Kilns switch fuel by switching converters rather than by switching kiln process, so fuel choice is independent of kiln technology. The biomass and waste-derived share is bounded by a ceiling derived from the kiln stock and its retirement schedule — precalciner kilns can take far more alternative fuel than wet kilns can. That ceiling is a technical frontier and reaching it takes time, so it is ramped from each region's observed base-year substitution rate up to the frontier by 2040. Without the ramp the model jumps to the frontier in the first period, which is a statement about thermodynamics rather than about how fuel supply chains actually develop.
Gas access as a physical constraint. Whether a kiln can switch to natural gas depends on whether gas physically reaches it. The share of each country's kiln capacity within reach of an existing or under-construction pipeline or LNG terminal is computed from plant coordinates and gas infrastructure geography, and bounds the gas share accordingly.
Clinker substitution. The clinker-to-cement ratio is where the largest near-term abatement in the sector sits, and it is modelled as an explicit blending decision rather than an assumed trajectory. A blender process takes four supplementary cementitious materials and produces the SCM stream that grinding consumes:
| Material | Cementitious yield | Where it comes from |
|---|---|---|
| Blast furnace slag | 0.85 | Endogenous — produced by the iron and steel module |
| Fly ash | 0.40 | Endogenous — produced by coal-fired power generation |
| Natural pozzolan | 1.00 | Supply process, volcanic geology |
| Limestone filler | 1.00 | Supply process, capped at 15% of the binder |
The first two are the important ones, because they make cement decarbonization depend on decisions taken in other sectors. Slag supply falls as blast furnaces give way to direct reduction; fly ash supply falls as coal generation retires. Both of those are things the model decides elsewhere, and both tighten exactly when cement most needs them. Limestone filler is chemically inert dilution rather than a reactive binder, so it is capped at 15% of the binder, consistent with ASTM C595 Type IL and EN 197-1 CEM II/A-LL.
Efficiency and electrification. Kiln and mill upgrades are available as technology choices with their own capital costs. Grinding and raw milling consume electricity, so they decarbonize with the grid, but there is no fuel-switching choice at those stages.
Demand to 2050. Cement is the one sub-sector here with a forward demand trajectory rather than a pinned base year. Each region's base-year tonnage is scaled by a growth index built from IEA WEO2025 cement production, taking the shape of the outlook but not its levels — the base year already reconciles with USGS by construction. World cement runs from 3,881 Mt to about 4,250 Mt by 2045 and then flattens, with China declining by a quarter over the horizon and India growing by three quarters. Cement tonnage is scenario-invariant in WEO2025: the IEA flexes the sector's energy intensity with policy rather than its output, which puts every lever on the supply side where this module models them.
What cement does not yet include
Note
Planned, not yet in the model. Carbon capture on cement — oxyfuel, amine post-combustion, calcium looping and electrified calcination — is specified against CEMCAP techno-economics but is not yet emitted. Until it is, a carbon-price run has no lever at all on process CO₂, which is roughly half of cement's emissions. Also planned: hydrogen kiln firing, LC3 calcined-clay cements, and clinker and cement trade — clinker being the traded intermediate that grinding-only regions depend on.
Brick
Brick is the largest tonnage in non-metallic minerals outside cement — 2,755 Mt, close to one and a half times world crude steel production — and until recently it was almost invisible in energy system models. It is represented here because leaving it out makes the rest of the sector's statistics impossible to interpret.
Kiln technologies. Six, spanning nearly the whole range of industrial formality: clamp kilns, fixed-chimney Bull's trench kilns, zigzag kilns, vertical shaft brick kilns, Hoffman kilns and tunnel kilns. Fuels are coal, biomass, gas and oil; biomass is about a third of South Asian brick energy and more than half of African.
Why the kiln menu is the whole point. A South Asian fixed-chimney Bull's trench kiln runs at about 1.35 GJ/t. Converting the same kiln to zigzag airflow brings it to about 1.05 for a few thousand dollars — close to the cheapest industrial abatement available anywhere in the world economy. A model given only a sector energy intensity cannot see that this option exists. India's calibrated kilns come out at 1.26 GJ/t for Bull's trench, 0.98 for zigzag and 0.79 for vertical shaft, weighting to the measured national figure.
The capital spread is twenty to one between a clamp kiln and a tunnel kiln per tonne of annual capacity, which is why the sector is informal — entry is nearly free — and why zigzag conversion is such cheap abatement, since it upgrades a kiln that already exists rather than replacing it.
Process CO₂ is zero, deliberately. Brick clays do contain carbonates and calcareous clays genuinely do emit, but the coefficient previously carried here could not be derived from chemistry, and the studies behind the sector's energy intensity measure total specific consumption — which for Bull's trench and clamp kilns already includes the coal mixed into the green brick. That fuel carbon was being counted twice. Zero is an assertion too, and it is the one that fails visibly.
Note
Planned, not yet in the model. A turnover constraint on kiln conversion. With costs but no growth limit the model converts the world fleet to zigzag and vertical shaft kilns almost immediately. That is economically real — the payback is under two years on fuel alone — but behaviourally implausible, because the binding constraints are skills, brick quality, siting and access to credit, none of which is a cost. Also planned: a carbonate-only process CO₂ factor with a source behind it, electric firing, and a demand driver following floor area.
Lime
Lime is the term that gets forgotten, and it is the second-largest source of process CO₂ in the model after cement. Calcining CaCO₃ to CaO releases 0.785 t of CO₂ per tonne of quicklime by stoichiometry alone, so world lime production emits roughly 340 Mt of CO₂ before any fuel is burnt at all.
Kiln technologies. Rotary, rotary-with-preheater, mixed-feed shaft, and parallel-flow regenerative, spanning 7.20 down to 3.50 GJ/t as global priors and calibrated per region from there. Fuels are coal, gas, oil and biomass.
Coupling to cement. Lime kilns buy 1.8 tonnes of limestone per tonne of quicklime from the same quarry processes that supply cement's raw meal. This is where the two sub-sectors genuinely interact: they are both calcination of local limestone for local use, they compete for the same rock, and they compete for the same alternative fuels.
Note
Planned, not yet in the model. Lime demand is exogenous and fixed at the base year. In reality a large share of it is consumed by steelmaking as a flux, so lime demand should follow steel production and route choice — a shift to scrap-EAF changes lime consumption substantially. It currently does not. Electric and hydrogen-fired lime kilns are also absent.
Glass
Products. Flat glass for construction, automotive and solar; container glass for packaging; fibre glass for insulation and composites. Each is modelled as a distinct product with its own demand.
Furnace technologies. Regenerative, recuperative, oxy-fuel, and all-electric melting. The electric melter is a genuine technology choice the model can select, which makes glass one of the two sub-sectors here where electrification is an available decarbonization route rather than an aspiration.
Fuels. Gas, oil and coal. Biomass is deliberately excluded for the physical reasons given above.
Process CO₂. The soda ash and limestone in the batch decompose during melting, giving about 0.19 t of CO₂ per tonne of glass, roughly 33 Mt worldwide.
Note
Planned, not yet in the model. Cullet. Recycled glass is 30–60% of a container glass batch and each 10% of cullet cuts melting energy by about 2.5%; it is not represented at all, which means the model cannot see the sector's most established efficiency measure. Soda ash is also not modelled as a produced commodity — it is the one raw material in this sector worth wiring up, being traded, energy-intensive and itself a source of process CO₂. Hydrogen firing is absent.
Ceramics
Products. Construction ceramics (tiles, the bulk of the tonnage), technical ceramics and refractories, and sanitaryware.
Kiln technologies. Tunnel kilns, roller hearth kilns, and electric kilns. As with glass, electric firing is a real choice available to the model. Fuels are gas, coal, biomass and oil.
Process CO₂ is zero, for the same reasons as brick: the coefficient previously carried was not derivable from chemistry and risked double-counting organics that the energy figures already include.
A known weakness. Refractories are mapped onto the technical ceramics commodity because it is the nearest available product, which is a stretch — 40 Mt of a different product with a different customer and a different kiln.
Note
Planned, not yet in the model. Hydrogen and biogas firing, low-carbon raw material substitution, and waste-heat recovery, all of which the sector's own roadmaps treat as central. A demand driver following construction activity.
Reconciliation with the IEA balances
The five sub-sectors together demand about 21,400 PJ, against an IEA NONMET subtotal of 16,340 PJ. Rather than scale the model down to fit, KiNESYS reconciles the two explicitly, and the reconciliation is itself a result.
Cement, lime, glass and ceramics alone come to about 16,300 PJ — which accounts for NONMET to within 2%. There is, in other words, no room in the reported statistics for brick at all. And brick is not small: three independent triangulations put world fired clay brick at 2.0–2.4 Gt, wanting nearly 5,000 PJ.
That energy is not hidden in the balance; it never entered it. Informal Bull's trench and clamp kilns buy coal outside formal supply chains and burn agricultural residue that no energy survey counts. Where any of it is recorded at all, it lands in the non-specified industrial catch-alls.
So the model draws that energy from the catch-all pool, under rules that apply equally to steel and chemicals:
- The trigger is physics, not arithmetic. A sector may only draw where the reported sub-sector falls below a floor its own physical activity cannot go under — roughly two thirds of world best practice, because our own production estimates are themselves uncertain. A sector that simply exceeds its subtotal does not qualify; it stays visible as an overshoot, which is the point.
- Nothing is created. A country's total industrial energy is pinned by supply-side statistics and is far more reliable than its split across sub-sectors, which is a survey artifact. The reconciliation treats the total as observed and the split as estimated, so this is re-attribution inside a fixed total rather than three sectors helping themselves to energy.
- The draw is netted over fuels before being spread across them. If the model burns coal where the balance reports gas, that is a fuel-mix disagreement, not misbooked energy. The pool is 38% electricity and a cement kiln cannot burn electricity, so this matters.
- It is capped at two thirds of the pool across all sectors, because emptying the catch-alls would assert that a region has no food processing, textiles or machinery.
The reconciliation moves about 2,984 PJ into non-metallic minerals, India alone taking 1,494, and emits an adjusted aggregate-demand table with the catch-alls depleted by exactly that amount. This is a build step, not only a diagnostic: anything moved here must be moved in the host model too, or the energy is counted twice.
The geography that falls out was not imposed and is the best evidence that the method works — the regions that qualify to draw are the regions with large informal brick industries.
Model Outputs
- Energy and emissions by sub-sector, kiln type and fuel, with process CO₂ reported separately from combustion CO₂ throughout — an essential distinction in a sector where roughly half the emissions come out of the rock.
- Kiln fleet composition over time, including which vintages of cement capacity retire when, and how fast informal brick kilns convert.
- Clinker-to-cement ratio and SCM sourcing, showing how much clinker substitution the model can actually achieve given slag and fly ash supply determined in the steel and power sectors.
- Alternative fuel substitution rates against the technical ceiling, by region.
- The reconciliation itself — which regions overshoot their reported statistics, by how much, and what that implies about the coverage of the underlying energy surveys.
Cross-sector coupling is the distinguishing feature
The reason this module sits inside a full energy system model rather than alongside one is that its two most important abatement levers are not under its own control.
Clinker substitution depends on slag from blast furnaces and fly ash from coal-fired power stations. Both are byproducts of activities the model is simultaneously trying to eliminate. A steel decarbonization pathway that replaces blast furnaces with hydrogen direct reduction removes the slag; a power decarbonization pathway that retires coal removes the fly ash. Both supplies contract precisely when cement most needs them, and a cement model run in isolation would never see it. Alternative fuels tell the same story from the other side: cement, lime, brick and ceramics all compete for the same limited industrial biomass, alongside every other sector that wants it.
Planned extensions
Collected from the sub-sections above, in rough order of how much they would change results:
| Extension | Why it matters |
|---|---|
| Cement CCS and low-carbon clinker | Without oxyfuel, amine capture, calcium looping, electrified calcination or LC3, a carbon price has no lever on process CO₂ — about half of cement's emissions and the largest single industrial process-CO₂ term there is |
| Forward demand drivers for the four sub-sectors outside cement | Cement has a WEO-driven trajectory to 2050; brick, lime, glass and ceramics are pinned at the base year. Brick should follow floor area, lime should follow steel and cement |
| Kiln turnover constraints | Costs alone let the model convert the world brick fleet in one period, which is economically real and behaviourally impossible |
| Lime demand coupled to steel | Lime is a steelmaking flux; a shift to scrap-EAF should move lime demand and currently does not |
| Hydrogen firing | Absent across all five sub-sectors, and central to the published roadmaps for glass and ceramics in particular |
| Cullet and material recycling | The established efficiency measure in glass, unrepresented |
| Soda ash | Traded, energy-intensive, and a process-CO₂ source in its own right |
| Electrification of brick and lime | Available to glass and ceramics today, absent from the other two |
| Cement and clinker trade | Clinker is the traded intermediate that grinding-only regions depend on |
| Carbonate-only process CO₂ for brick and ceramics | Currently zero, which is defensible but wrong for calcareous clays |
Aluminium
Aluminium production is a critical industrial activity due to its versatility and widespread applications in sectors such as transportation, construction, and packaging. However, it is also highly energy-intensive, particularly in the smelting process. KiNESYS provides a detailed framework to model the aluminium sector, addressing its unique energy needs and emissions challenges.
Scope and Coverage
Processes and Technologies
- Bauxite Mining and Alumina Refining:
- Models the extraction of bauxite and its conversion into alumina (aluminium oxide) through the Bayer process.
- Tracks energy use and emissions associated with high-temperature digestion and calcination.
- Primary Aluminium Production:
- Focuses on the Hall-Héroult process for electrolysis of alumina to produce aluminium.
- Includes the carbon anode consumption, a significant source of direct CO₂ emissions.
- Casting and Finishing:
- Models energy requirements and emissions in shaping and surface treatments.
Feedstock and Energy Inputs
- Raw Materials:
- Bauxite as the primary ore.
- Includes alumina as a key input for smelting.
- Energy Sources:
- Tracks electricity demand for electrolysis, highlighting the critical role of energy decarbonization.
- Includes fuel use in refining and calcination processes.
- Models regional differences in electricity mix and its impact on emissions.
Emissions and By-products
- Greenhouse Gas Emissions:
- Process emissions from carbon anode consumption in smelting.
- CO₂ emissions during electrolysis.
- Combustion emissions from refining and calcination.
- By-products:
- Tracks red mud waste from refining and evaluates options for reuse or mitigation.
Key Features for Decarbonization Analysis
-
Electrification
- Models the impact of decarbonizing electricity grids on aluminium production.
- Simulates the adoption of renewable energy in regions reliant on coal or gas-fired electricity.
-
Advanced Smelting Technologies
- Inert Anodes:
- Tracks the transition to inert anodes in electrolysis, eliminating carbon-based anode emissions.
- Evaluates technology readiness and cost implications.
- Direct Hydrogen Reduction:
- Explores emerging technologies that use hydrogen instead of carbon-based anodes.
- Inert Anodes:
-
Energy Efficiency
- Models upgrades to existing technologies, including:
- Heat recovery systems in refining.
- Improved cell designs for energy-efficient electrolysis.
- Models upgrades to existing technologies, including:
-
Waste Management and Circular Economy
- Models strategies for managing red mud and converting it into value-added products.
- Tracks improvements in waste heat recovery and slag reutilization.
-
Regional Contextualization
- Customizes pathways based on regional energy mixes, resource availability, and policy frameworks.
- Highlights differences in emissions profiles between regions reliant on hydroelectricity vs. fossil fuels.
Model Outputs
- Energy and Emissions Profiles:
- Tracks electricity use and emissions for each production stage.
- Provides granular data on the impact of energy decarbonization.
- Technology Scenarios:
- Evaluates the adoption of inert anodes, energy-efficient technologies, and other innovations.
- Quantifies cost and emissions impacts for various decarbonization pathways.
Depth of Analysis
- Process-Specific Insights:
- Captures the unique energy and emissions characteristics of each production step.
- Supports targeted interventions for reducing emissions in refining and smelting.
- Policy Impact Simulation:
- Models the effect of carbon pricing, renewable energy incentives, and emission reduction targets.
- Evaluates regional trade-offs between emissions reduction and economic competitiveness.
- Technology Evolution:
- Tracks the progress of emerging technologies like inert anodes and direct hydrogen reduction.
- Simulates timelines for achieving large-scale adoption.
Building a Low-Carbon Aluminium Industry
The KiNESYS platform models the aluminium sector with precision, offering robust tools for analyzing energy use, emissions, and decarbonization strategies. By addressing both technological and systemic challenges, it supports the transition to a low-carbon aluminium industry.