Items detail
Introduction
This shows the basic information, topology, and parameters for all items — processes, commodities, user constraints, and commodity groups. When the model includes commodity locations (from a ~commodity_geo table), you can also open a Grid Map of commodities and trade links.
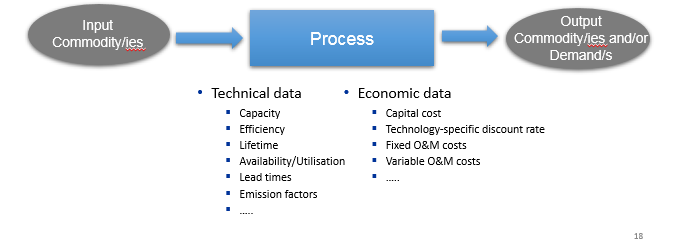
Basic description of a TIMES process
- A process converts input commodity(ies) to output commodity(ies)
- Each process is linear (e.g. output proportional to input, investment and fixed O&M costs scale with capacity / variable O&M scale with activity)
- A power plant converts input fuel (e.g., coal/oil/gas/nuclear/renewable source) in electricity
- A plug-in diesel hybrid car can be modelled as a process that converts electricity and/or diesel to passenger-miles
- A typical national model may have ~1000 processes
How to use it?
- Choose a region from the drop-down (or All).
- Switch the left list with Prc, Com, UC, or CG, then search or select an item. The center Pivot, Detailed View, and topology tabs follow that selection.
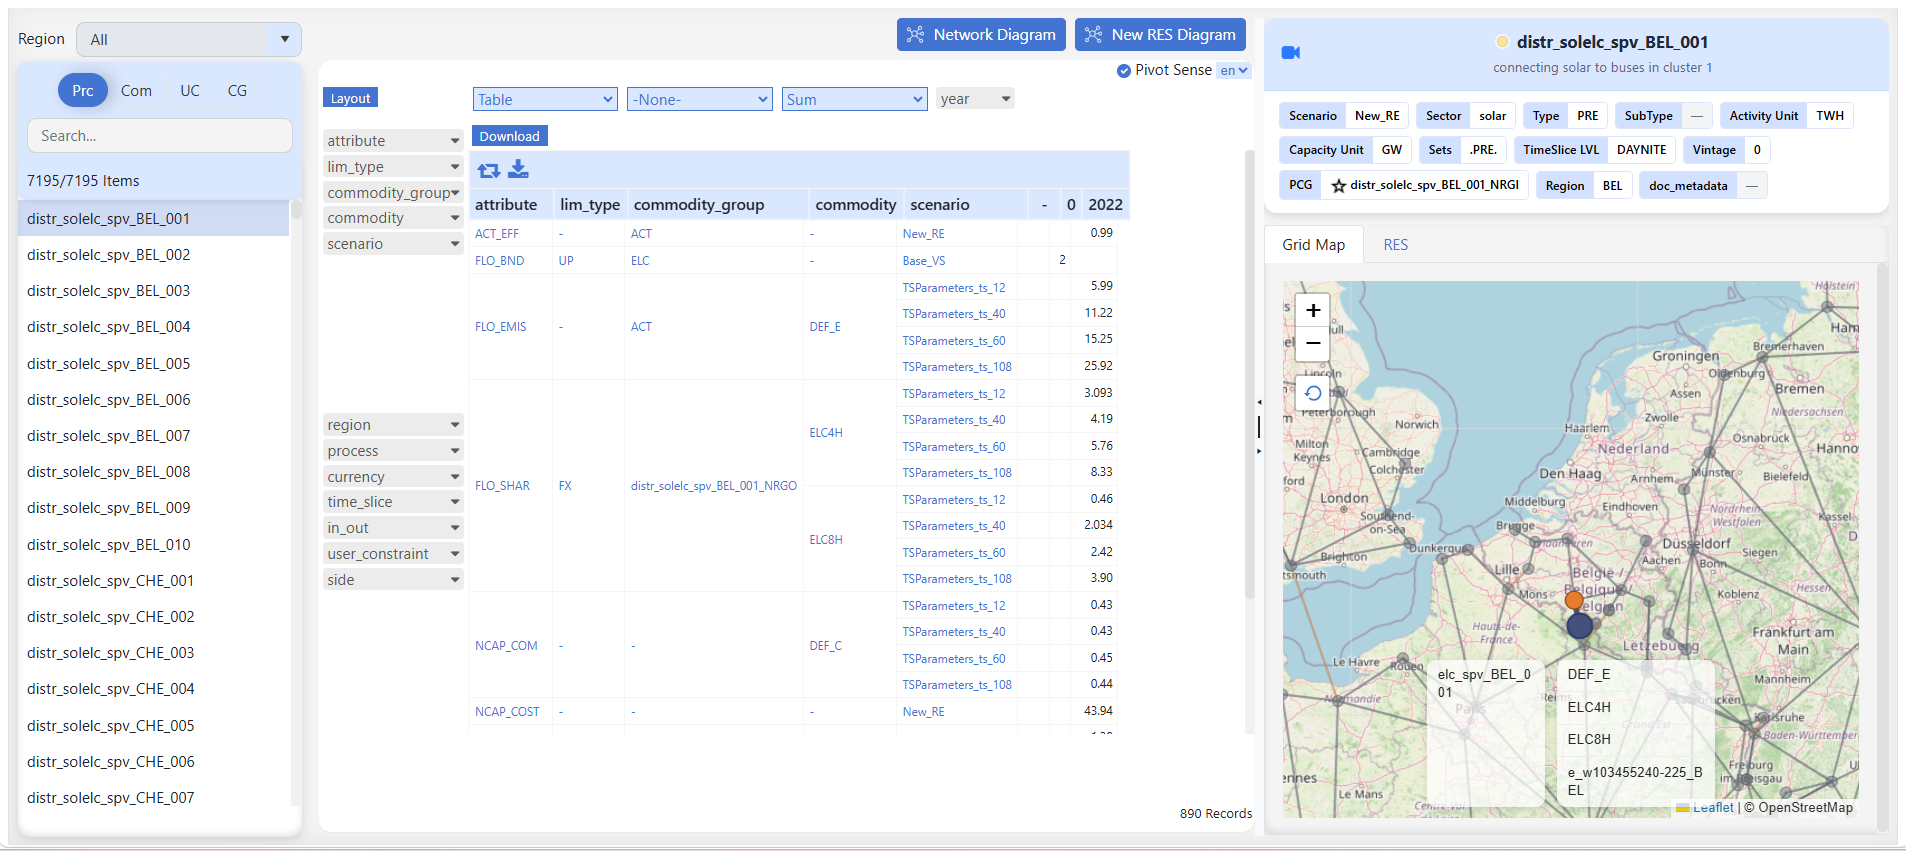
Where to view the data
1. Network Diagram
Introduction
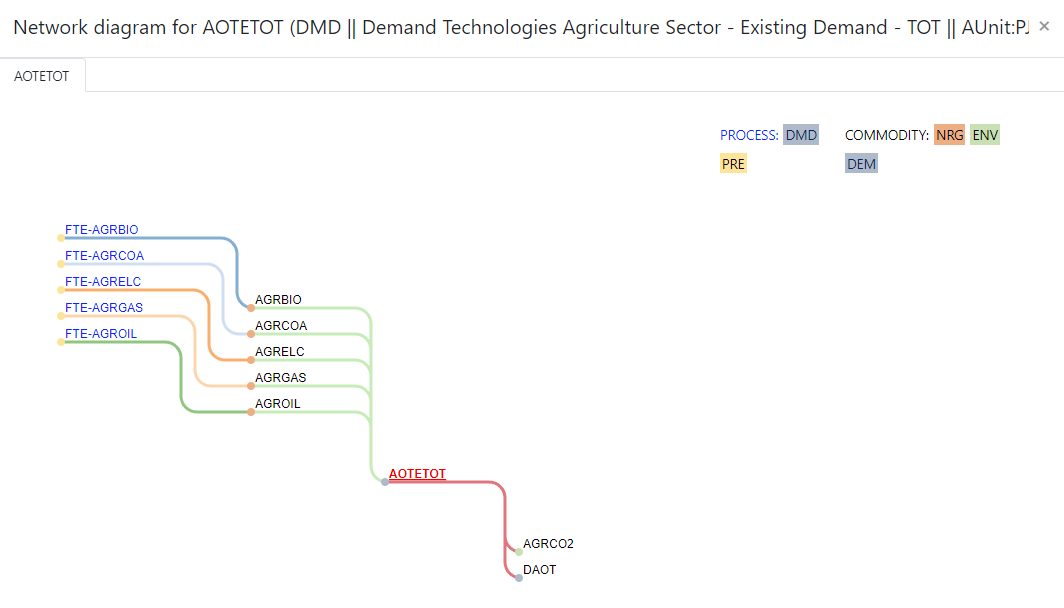
Network Diagram is a separate window that draws the energy system around the process or commodity you selected. Items sit in columns from left to right — upstream on the left, the selected item in the middle, downstream on the right. Curved paths show how commodities and processes connect. The diagram includes up to five input and five output levels automatically.
Purpose
Use it for a fast neighborhood scan. Use New RES Diagram when you need more hops, filters, or chain highlighting.
How to use
- In the left list, select a process or commodity.
-
Above the Pivot, click Network Diagram (or press Alt+N+D). The button is hidden for User constraint and Commodity Group.
-
The selected item is in the center column (red, bold, underlined). Process names are blue; commodity names are black.
- Colors follow TIMES types (legend, top-right). Curved paths are connection bundles — hover a path to isolate it.
- Hover an item for type, description, units, and time-slice level. Click an item (not the center or MORE...) to open it as a tab. Selecting another left-list item adds a tab.
- If a level has more than 25 items, a non-clickable MORE... node means the list was truncated. Pick a more specific item, or filter in New RES Diagram.
Tip
Network Diagram and New RES Diagram both show RES topology, but the layout and controls differ. Use Network Diagram for a quick bundled view up to five levels on each side. Use New RES Diagram when you need Left / Right levels (0–10), filters, or chain highlighting by clicking node boxes.
2. New RES Diagram
Introduction
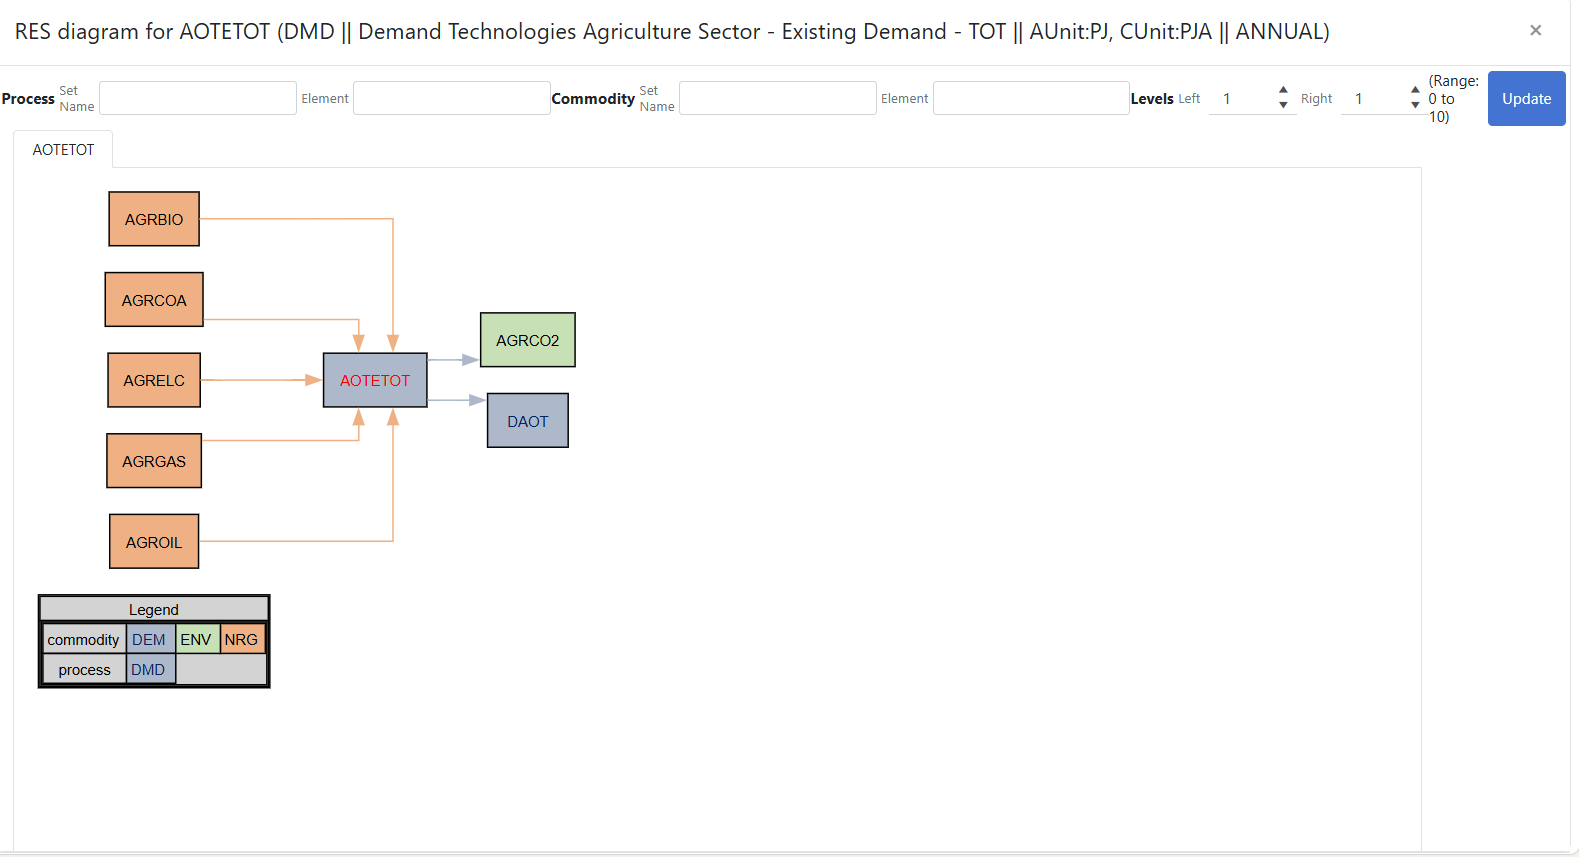
New RES Diagram is a separate window that shows a Reference Energy System graph for the process or commodity you selected. Inputs sit on the left, the selected item is in the center, and outputs sit on the right. Boxes use TIMES type colors, with a legend in the bottom-left.
Purpose
Use it when one hop is not enough: you can show 0–10 levels on each side, keep only selected sets or names, and walk the network in tabs. Basic View on the RES tab stays at one hop.
How to use
- In the left list, select a process or commodity.
-
Above the Pivot, click New RES Diagram (or press Alt+N+R). The button is hidden for User constraint and Commodity Group.
-
Inputs are on the left, the selected item in the center, outputs on the right. Colors follow TIMES types (legend, bottom-left).
- Set Left / Right hops (0–10, default 1) and click Update. 0 hides that side.
-
Filter with the top bar, then Update. Leave a field blank for no filter:
Control What to type Process → Set Name A process set (User Set or TIMES Set) Process → Element Names (comma-separated) or a wildcard such as *GAS*Commodity → Set Name A commodity set (User Set or TIMES Set) Commodity → Element Names (comma-separated) or a wildcard -
Click the name in a box to open that item as a tab. Click the box (not the name) to highlight its chain. Pan by dragging; zoom with the mouse wheel.
- If the graph is truncated, a note reads The data shown here is not complete. Narrow Levels or the filters, then Update.
Note
New RES Diagram is not the same as the RES tab. RES is Basic View — the selected item and its direct inputs and outputs only. Use New RES Diagram when you need more hops, filters, or to walk the network by opening items in tabs.
3. Pivot View
Introduction
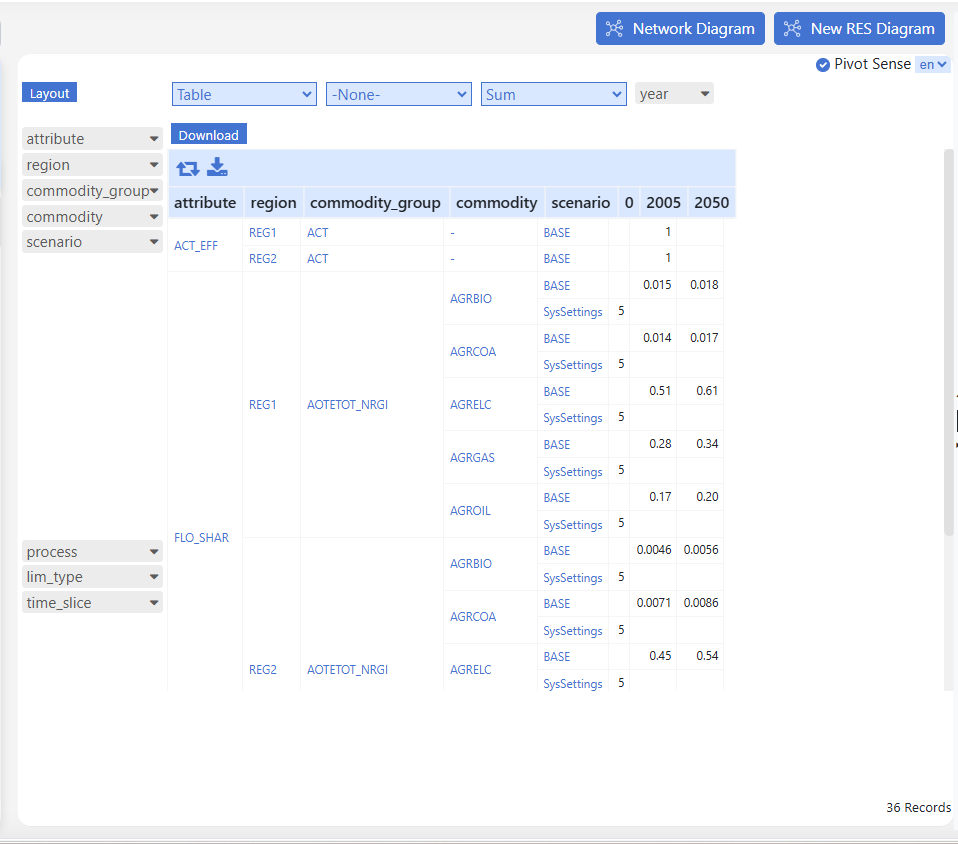
The Pivot is the center panel on Items detail. It is an interactive table of flat-file input data (parameters and assumptions) for the item selected in the left list — a process, commodity, user constraint, or commodity group.
Purpose
Use it to review the parameters actually read for that item, rearrange dimensions, and download the table.
How to use
- Select an item in the left list. The Pivot loads that item’s parameters.
- Use Layout to drag dimensions onto rows, columns, or filters (for example attribute, region, commodity, scenario).
For general pivot controls, see Pivot Grid.
4. Detailed View
Introduction
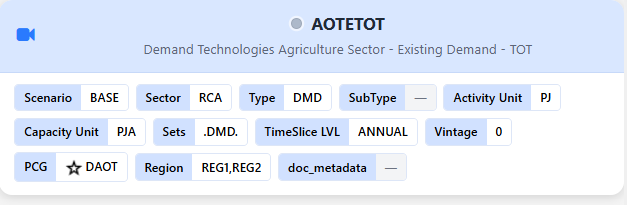
Detailed View is the summary card at the top of the right panel, above the Grid Map and RES tabs. It shows the selected item’s name, description, and classification badges from the model sets (type, units, sets, region, and similar fields).
Purpose
Use it to confirm the item’s identity and classification. Parameter values stay in the Pivot; this card is metadata only.
How to use
Select an item in the left list. The card updates automatically — no extra button or tab.
- The camera icon opens a short Items View video on YouTube.
- Header — Item name with a colored dot for Type (same colors as the RES diagrams). Description is the line below.
- Badges — Label and value pairs (for example Type, Sector, Activity Unit). Empty fields show —. Hover a long value for the full text.
- PCG — For processes, Primary Commodity Group includes a star icon beside the value.
| Item type | Typical fields |
|---|---|
| Process | Scenario, Sector, Type, SubType, Activity Unit, Capacity Unit, Sets, TimeSlice LVL, Vintage, PCG, Region |
| Commodity | Scenario, Type, SubType, Activity Unit, Sets, TSLVL, LimType, PeakTS, Region |
| User constraint | Scenario, Region, LimType |
| Commodity group | Scenario, Process, Region |
Note
A doc_metadata badge appears when the model has documentation metadata. With a single region, values are for that region; with All, a badge may list several values if the item differs across regions.
5. Grid Map
Introduction
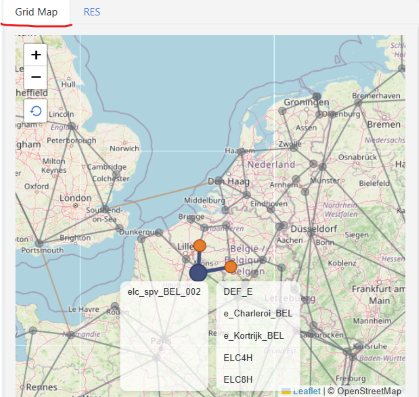
Grid Map is a tab on the right panel (next to RES) that places commodities and trade processes on a geographic map. Points are commodities that have a location (latitude and longitude). Lines are processes that link two commodities (typically trade): gray for the same region, orange for cross-border.
Purpose
Use it to see where items sit and how they connect. Locations come from a ~commodity_geo table; without that table (or before Synchronize), the map is empty and Items detail stays on RES.
Setting up ~commodity_geo
Grid Map needs latitude and longitude for commodities. Add them in Excel with the ~commodity_geo tag.
-
File location Put the table in the model Trade Links workbook:
Folder SuppXLS/Trades/(under the model root)File name ScenTrade__Trade_LinksThis is the same workbook used for trade-link definitions (for example ~TradeLinks). Add ~commodity_geo on its own sheet in that file. If the workbook is missing, create it in
SuppXLS/Trades/with this exact name so Veda classifies it as Trade Links. -
Structure of ~commodity_geo table
commodity region lng lat e_AixLesBains_FRA FRA 6.418382 45.66201 e_Annecy_FRA FRA 5.804484 46.05579 e_Aosta_ITA ITA 7.431605 45.603 e_Arlon_BEL BEL 5.797338 49.56518 e_Basildon_GBR GBR 0.716158 51.4405 e_Bastia_FRA FRA 9.449985 42.52849 e_Bayonne_FRA FRA -1.43074 43.42153 e_Belfort_FRA FRA 6.663611 47.36735 e_Bellinzona_CHE CHE 8.83773 46.44124 e_Brescia_ITA ITA 9.820005 45.67123 e_Briancon_FRA FRA 6.712357 45.21485 - commodity and region are required.
- lng and lat are longitude and latitude in decimal degrees.
- A commodity can appear on more than one row if it has a location in more than one region.
Trade links on the map still come from the usual trade tables in the same file — ~commodity_geo only supplies coordinates for the points.
-See it in Navigator
- Open Navigator for the model.
- In the Trade Scenarios [TS] quadrant (see Navigator — Trade Scenarios), find the row
_Trade_Links. That row is theScenTrade__Trade_Linksworkbook. - Check the import checkbox if the file is marked ToImport (orange).
- After Synchronize, hover the
_Trade_Linksrow to see imported tags; commodity_geo appears in the tooltip with its row count. - File status follows the usual Navigator legend (Consistent, Inconsistent, and so on).
How to use
Open the Grid Map tab (below Detailed View). If the model has no ~commodity_geo data, the map is empty and Items detail stays on RES.
- Pan and zoom as on a normal map. Hover a point for commodity and region; hover a line for the process, the two commodities, and whether it is cross-border.
- Click a point to select that commodity in the left list. Use reset (restore icon, top-left) to return to the full linked network.
- Keep the tab open and change the left-list selection:
- Commodity with trade links — The selection is highlighted; linked processes and opposite commodities are emphasized; the rest is dimmed.
- Commodity with no links — If it has a location, it appears as a larger marker; other points stay dimmed.
- Process — Inputs and outputs that have map locations are shown. Lists at the bottom show inputs (left) and outputs (right); click a name to select it.
- User constraint or commodity group — The map returns to the default linked network.
By default the map shows only commodities that already have a trade link. Unlinked locations appear when you select them.
Note
If the model has no ~commodity_geo table (or it has not been synchronized), there is nothing to plot. You can still open Grid Map; the map stays empty until locations are in ScenTrade__Trade_Links and the model has been synchronized. Trade links still come from the usual trade tables — ~commodity_geo only supplies coordinates for the points.
6. Basic View (RES)
Introduction
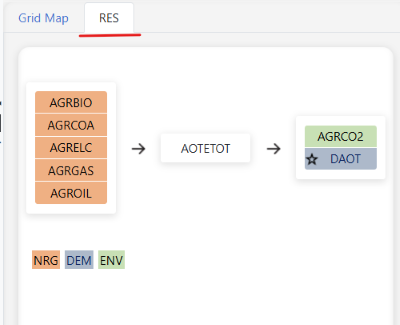
Basic View is the RES tab in the lower-right panel (below Detailed View, next to Grid Map). It is a one-hop Reference Energy System for the item in the left list: the selected item in the center, direct inputs on the left, direct outputs on the right.
Purpose
Use it to see what connects to one process, commodity, user constraint, or commodity group without opening a diagram window. For more hops, use Network Diagram or New RES Diagram.
How to use
- Select an item in the left list.
-
Open the RES tab if Grid Map is showing. The panel updates automatically.
-
Flow is left to right. Colors follow TIMES types (legend under the lists). Hover a name for its description.
- Click a name to select it in the left list (Pivot, Detailed View, and Basic View follow). Clicking an input or output switches dimension (commodity ↔ process). Clicking a user constraint switches the left list to UC.
- Empty extra lists are hidden when the model has no data for them.
| Position | What it lists |
|---|---|
| Left | Direct inputs — commodities into a process, or processes that produce the selected commodity |
| Right | Direct outputs — commodities out of a process, or processes that consume the selected commodity |
| Above the center | Auxiliary outputs |
| Below the center | Auxiliary inputs |
| Top-left | User constraints that include this process or commodity |
| Bottom-left | NCAP_ICOM — consumed when new capacity is built |
| Top-right | NCAP_OCOM — produced when new capacity is built |
A star next to a commodity name marks membership in the process Primary Commodity Group (same icon as Detailed View).
The region drop-down filters topology. With a single region, lists are for that region. With All, you see the combined neighborhood across regions.
Note
When the left list is on User constraint or Commodity Group, the arrows become link icons. Those modes show membership, not process–commodity flow.